Customer Experience Analytics Platform,Workspaces
March 2018 - March 2020
March 2018 - March 2020
Roles and responsibilities
- Concept strategy & vision, collaborating with Product Management on scoping & MVP.
- UX flow and wireframes, data visualization and patterns.
- User interviews, customer demos, and testing.
-
Collaboration with the UI designers, detailing the components and reviewing implementation.
- Continues development of concepts and improvements based on user feedback.
Workspaces allow our customers to combine and segment feedback data in any way that fits their organization.It is robust, flexible, simple-to-use tool for teams analyze and act upon all their feedback in one place.
Workspaces allow our customers to combine and segment feedback data in any way that fits their organization.
It is robust, flexible, simple-to-use tool for teams analyze and act upon all their feedback in one place.
UX design
Phase 4: Scoping & MVP
Based on the research and concepts we came up with the concept team, we got the approval from the stakeholders to start building. We decided to build a whole new platform, and we had to scope the concept and find the best Minimal Viable Product.
We decided to start with Usabilla’s targeted web and app forms, as 80% of our customers’ feedback comes through them. Most of our customers have to duplicate these forms in multiple touch-points (like web, mobile, and app) and/or has domains in multi-languages or for multi-brands.
We decided to start with Usabilla’s targeted web and app forms, as 80% of our customers’ feedback comes through them. Most of our customers have to duplicate these forms in multiple touch-points (like web, mobile, and app) and/or has domains in multi-languages or for multi-brands.
Our goals were:
Create environments where our customers can compare and combine their leading Key Performance Indicators from all their different touch-points.
Get more users within our customer’s organizations engaged with their user feedback by ensuring that the feedback becomes more relevant for the teams and, therefore, more manageable and actionable.
What problem are we trying to solve?
Our (enterprise) customers are straggling to manage and get an overview of all their KPIs and feedback from different channels. Make the different teams accountable, engage, and act upon the feedback.
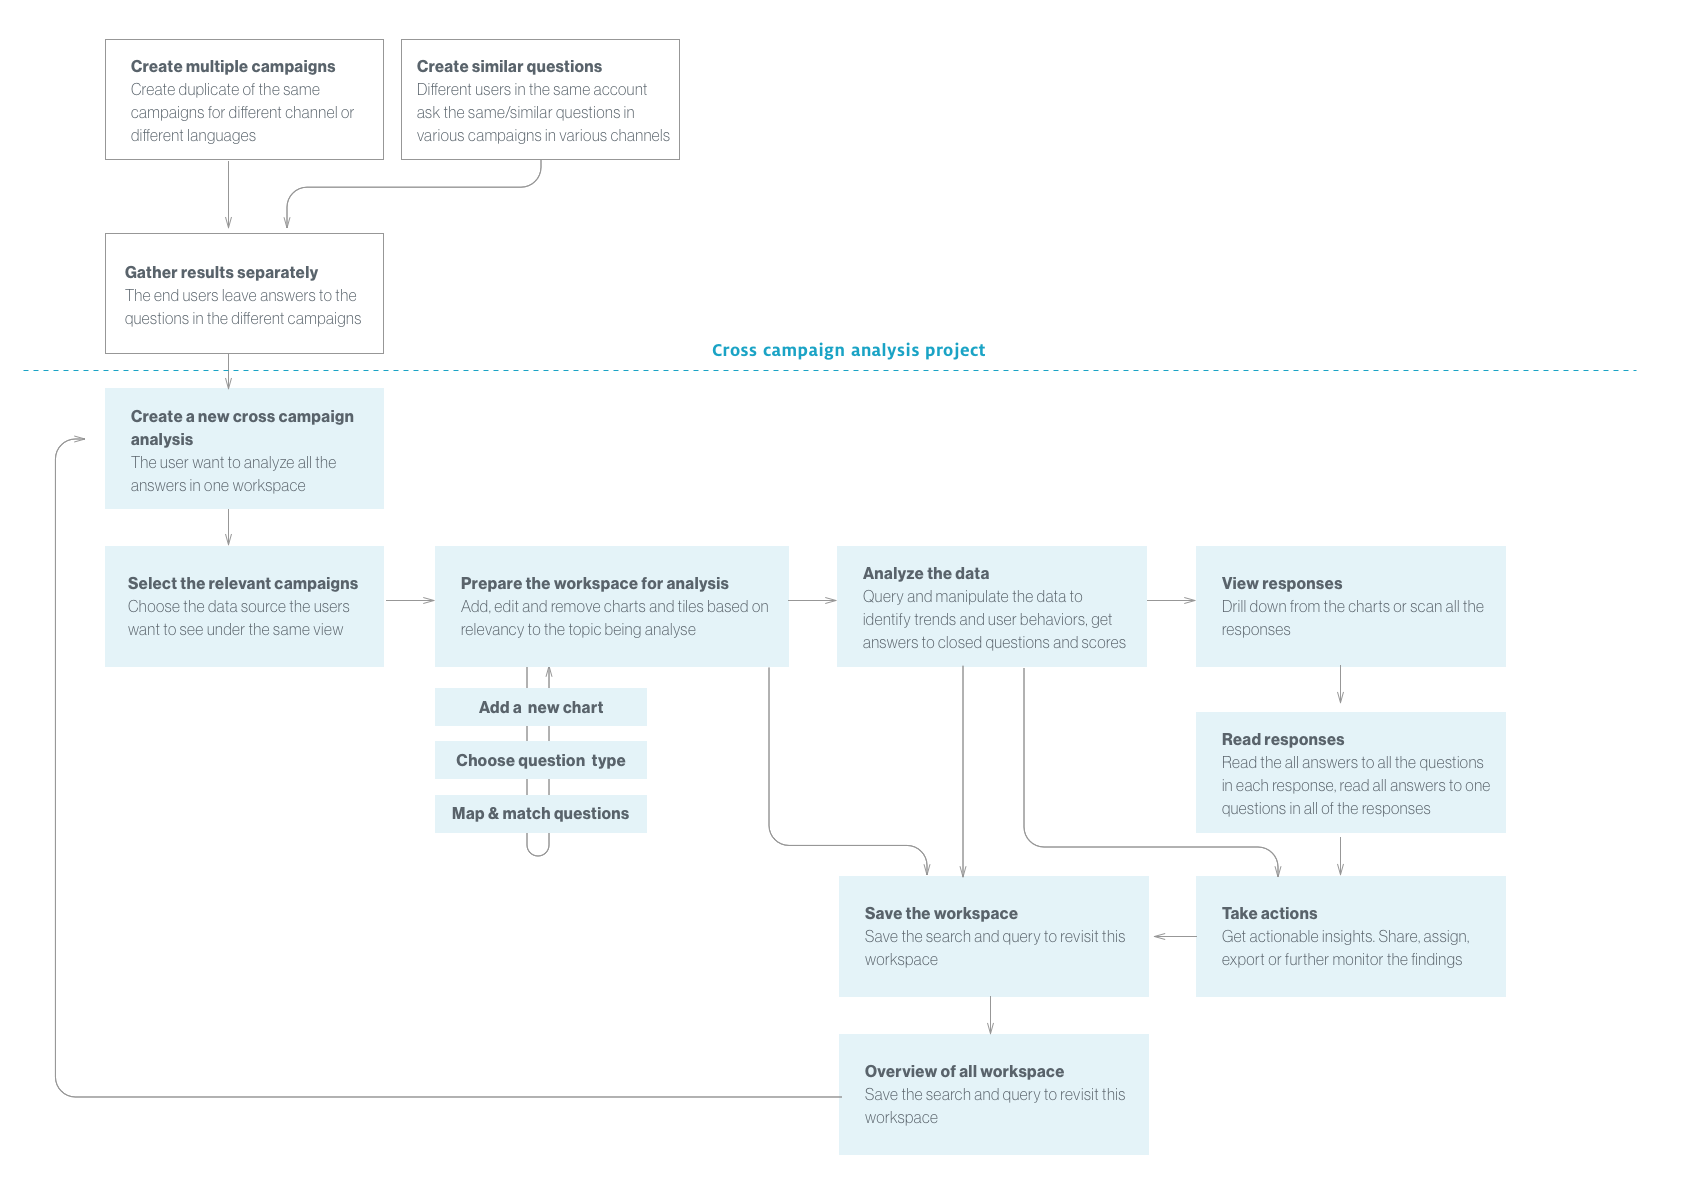
Products main user flows
Phase 5: Requirement
& Detailing
Data visualization & Interaction design
Every quarter together with my PM and the team’s engineering lead we decide on the features we want to add or improve in Workspaces. We prioritize based on our customer’s feedback (collected view our feedback forms), business needs, competitor strategy, and engineering opportunities.
Then depending on the scope of the feature we go through the design cycle. Problem definition ~ exploration ~ ideation ~team kickoff ~ customer interview/testing ~ detailed design ~ refinement ~ review implementation ~ test ~ and iterate based on feedback.
My main challenges:
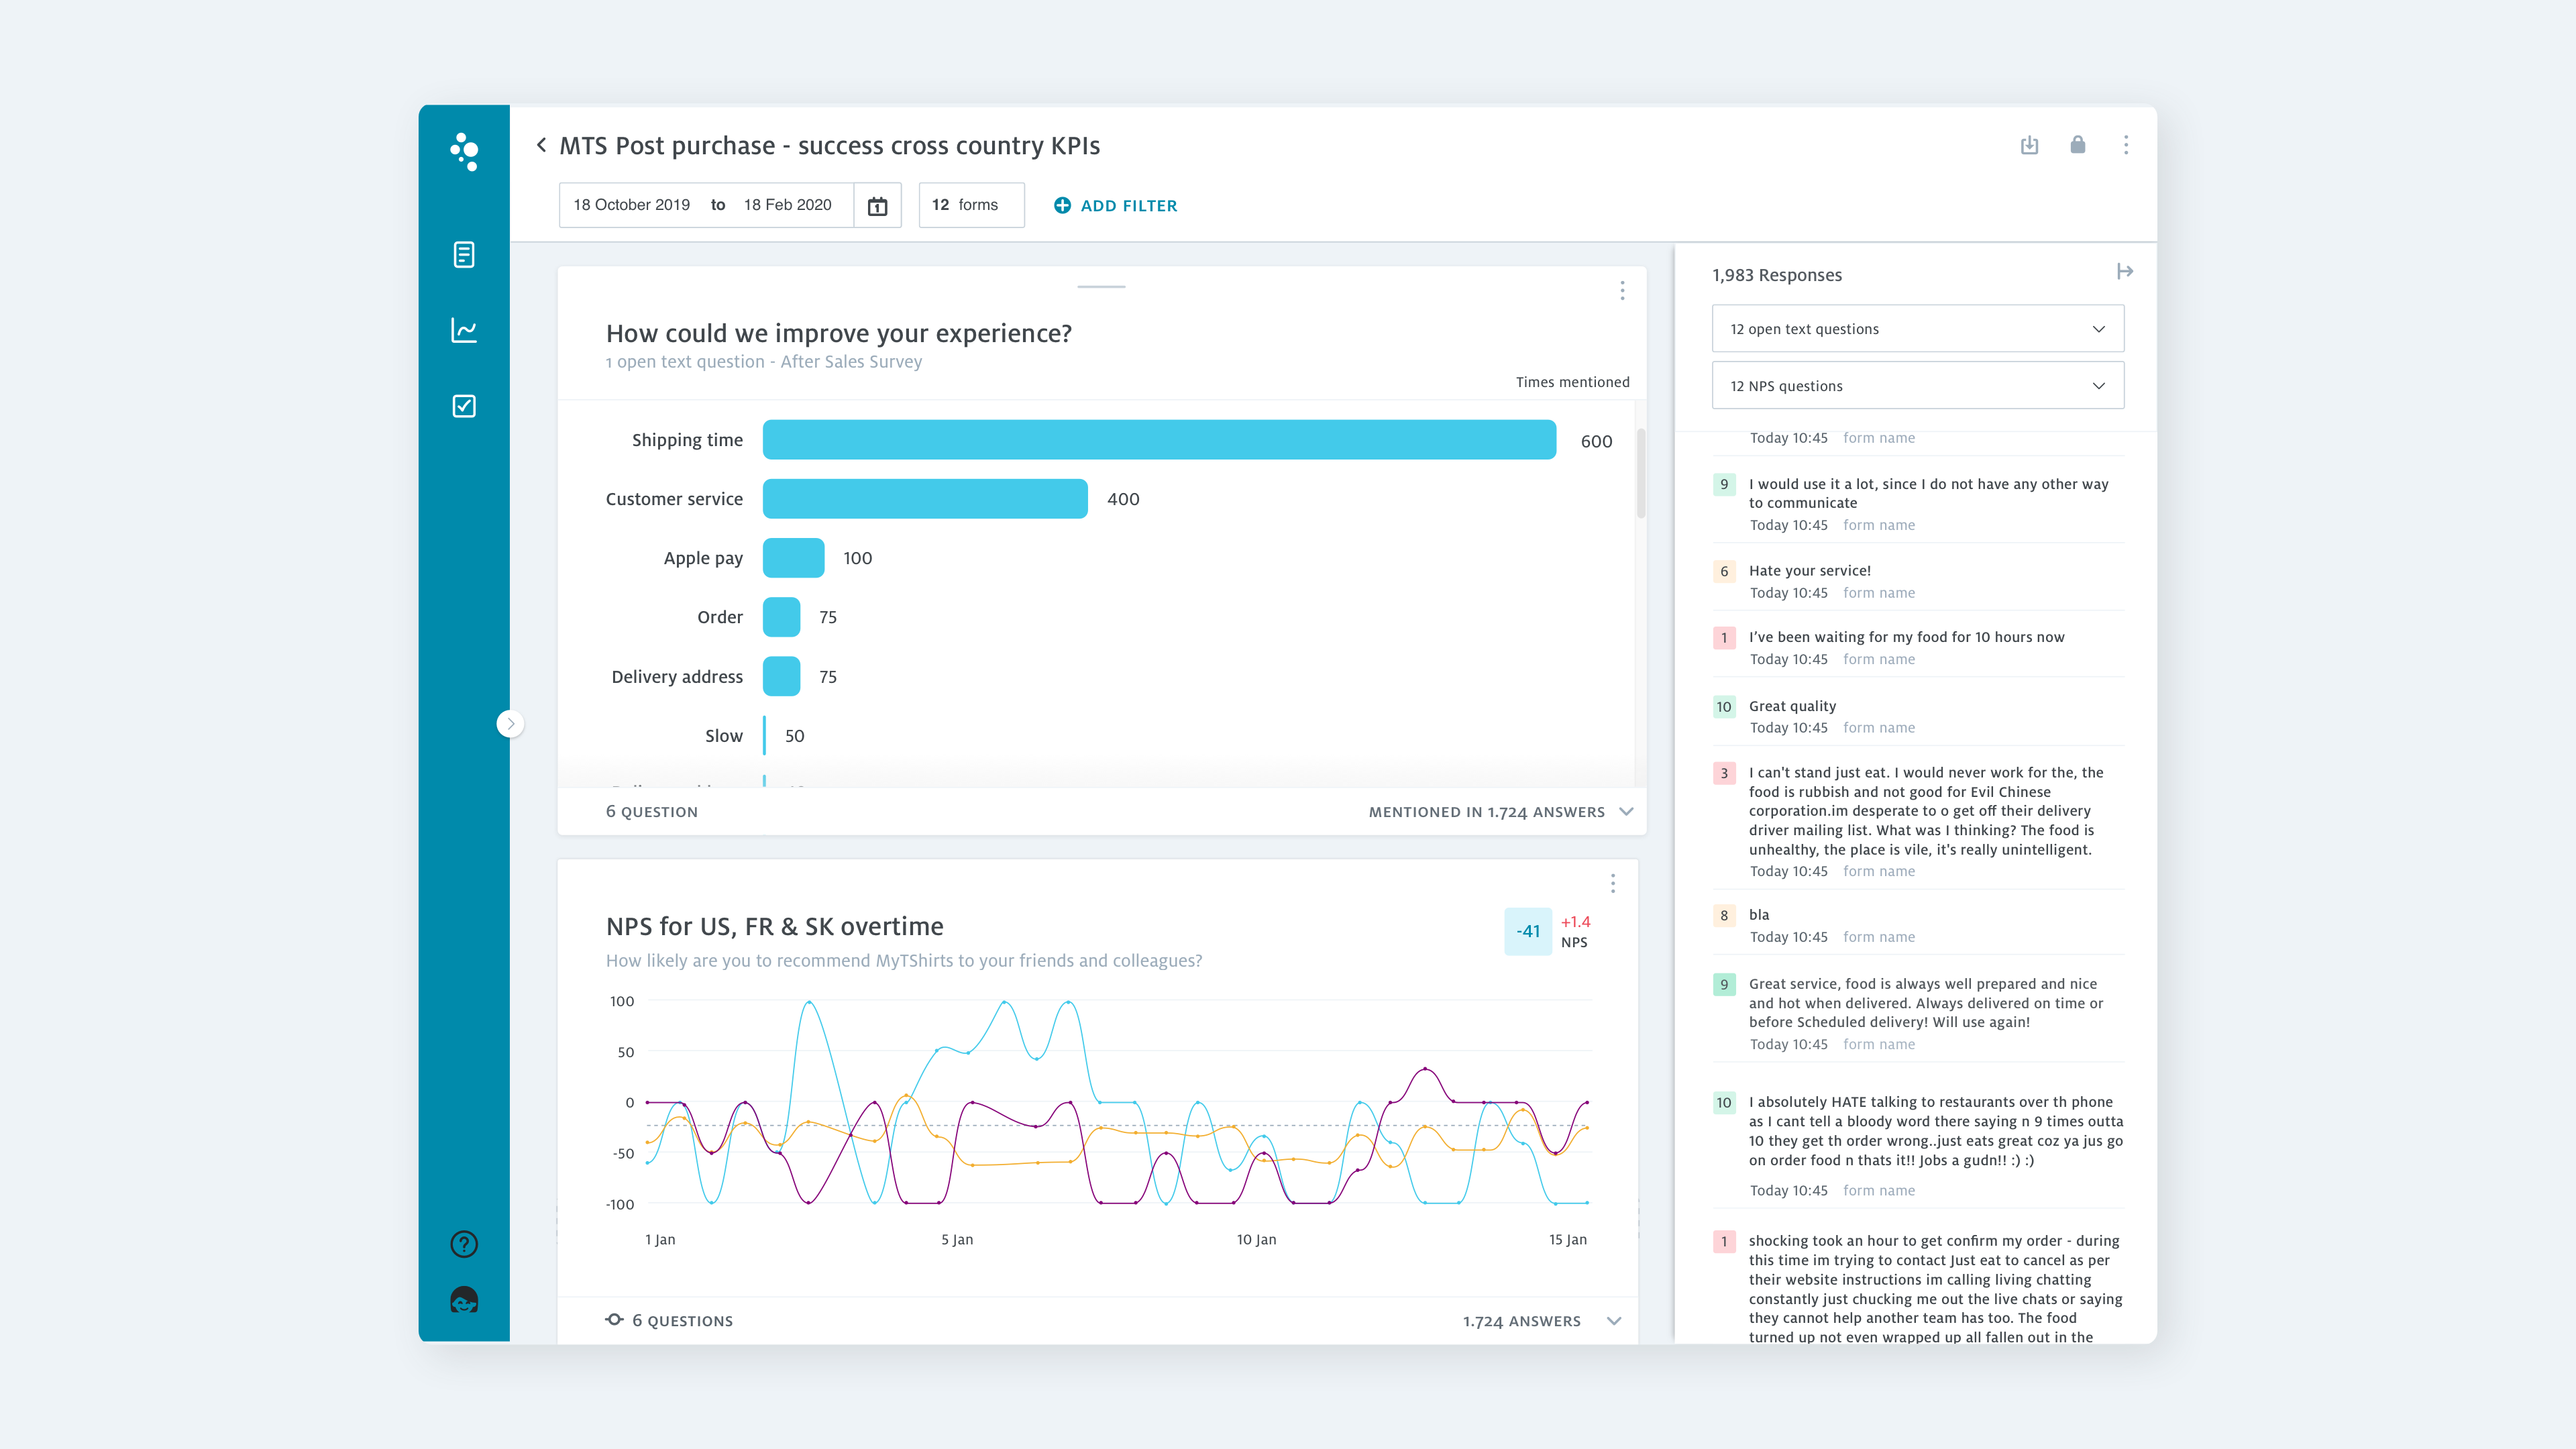
Designing Workspaces has all the expected challenges of designing a live dashboard; I had to take all stats of data into account, from empty to overcrowded. I had to keep the visualization readable, accurate, and follow data visualization best practices. Both data-savvy experts and complete novices use this product; this means I must create meaningful insights that are simple to interpret. The biggest challenge of Workspaces is that every visualization has to consider data from multiple forms; everything must be customizable and adjustable based on the user’s data and reporting structure.
While working on Workspaces, I had to design the foundation, such as the overview page, creation flow patterns, and continuously evolving and iterating on the solutions. I also designed the query builder logic and different filters based on product priority. My favorite part is designing the various data visualizations helping the customers understand their customer’s needs.
While working on Workspaces, I had to design the foundation, such as the overview page, creation flow patterns, and continuously evolving and iterating on the solutions. I also designed the query builder logic and different filters based on product priority. My favorite part is designing the various data visualizations helping the customers understand their customer’s needs.
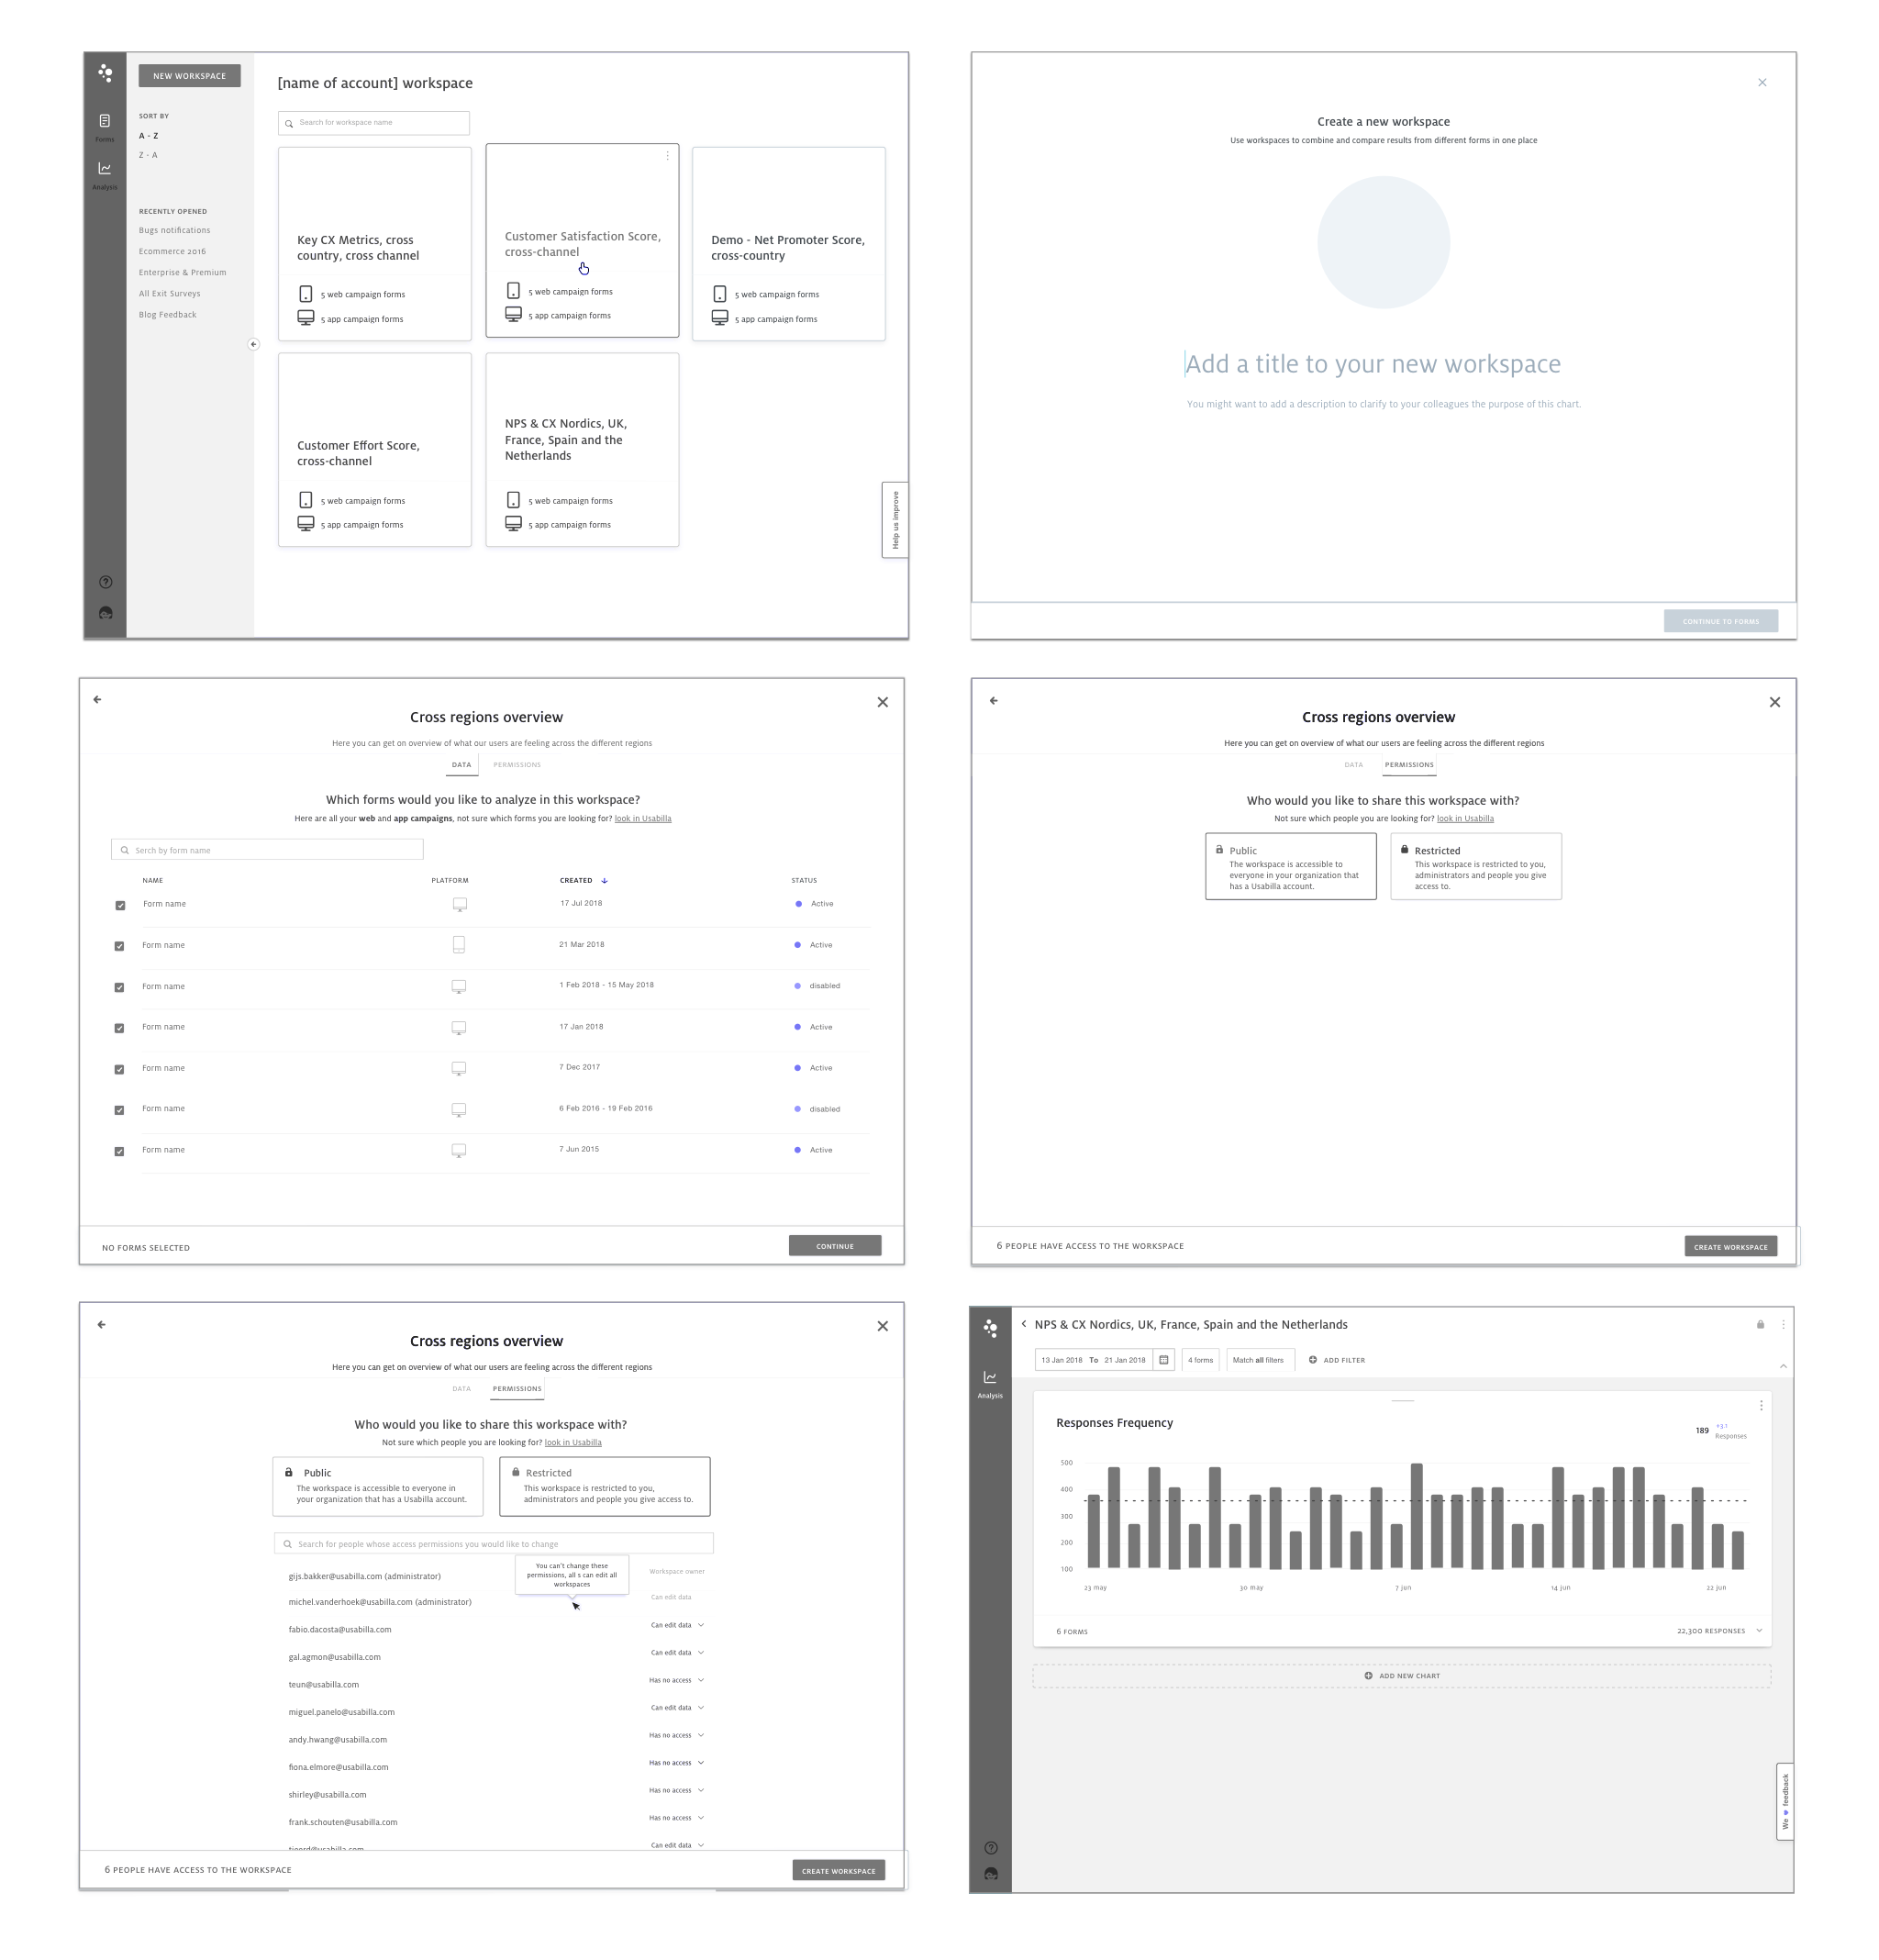
Workspace Overview & Creation
When admins collect feedback from multiple forms in different touch-points, they want to re-structure the feedback in a way that is the most relevant to their teams and make it more manageable, and the teams can be accountable for their feedback.
Step 1: Name and description. Step 3: Select the forms based on the touchpoint they want to merge or compare in the workspace.
Step 4: Select the users they want to share the workspaces with based on the team strutter and their area of responsibilities.

Tile creation
When customers are asking similar questions and different touch-points and tracking multiple KPIs, they want to merge and compare the results to get a better understanding of the feedback and report on the results.Step 1: Name and description. Step 2: Select the tile type (based on the different question type)
Step 3: Select the questions based on the touchpoint the user want to merge compare in the tile.
Step 4: Select the visualization that will best represent the result type and goal of tracking.
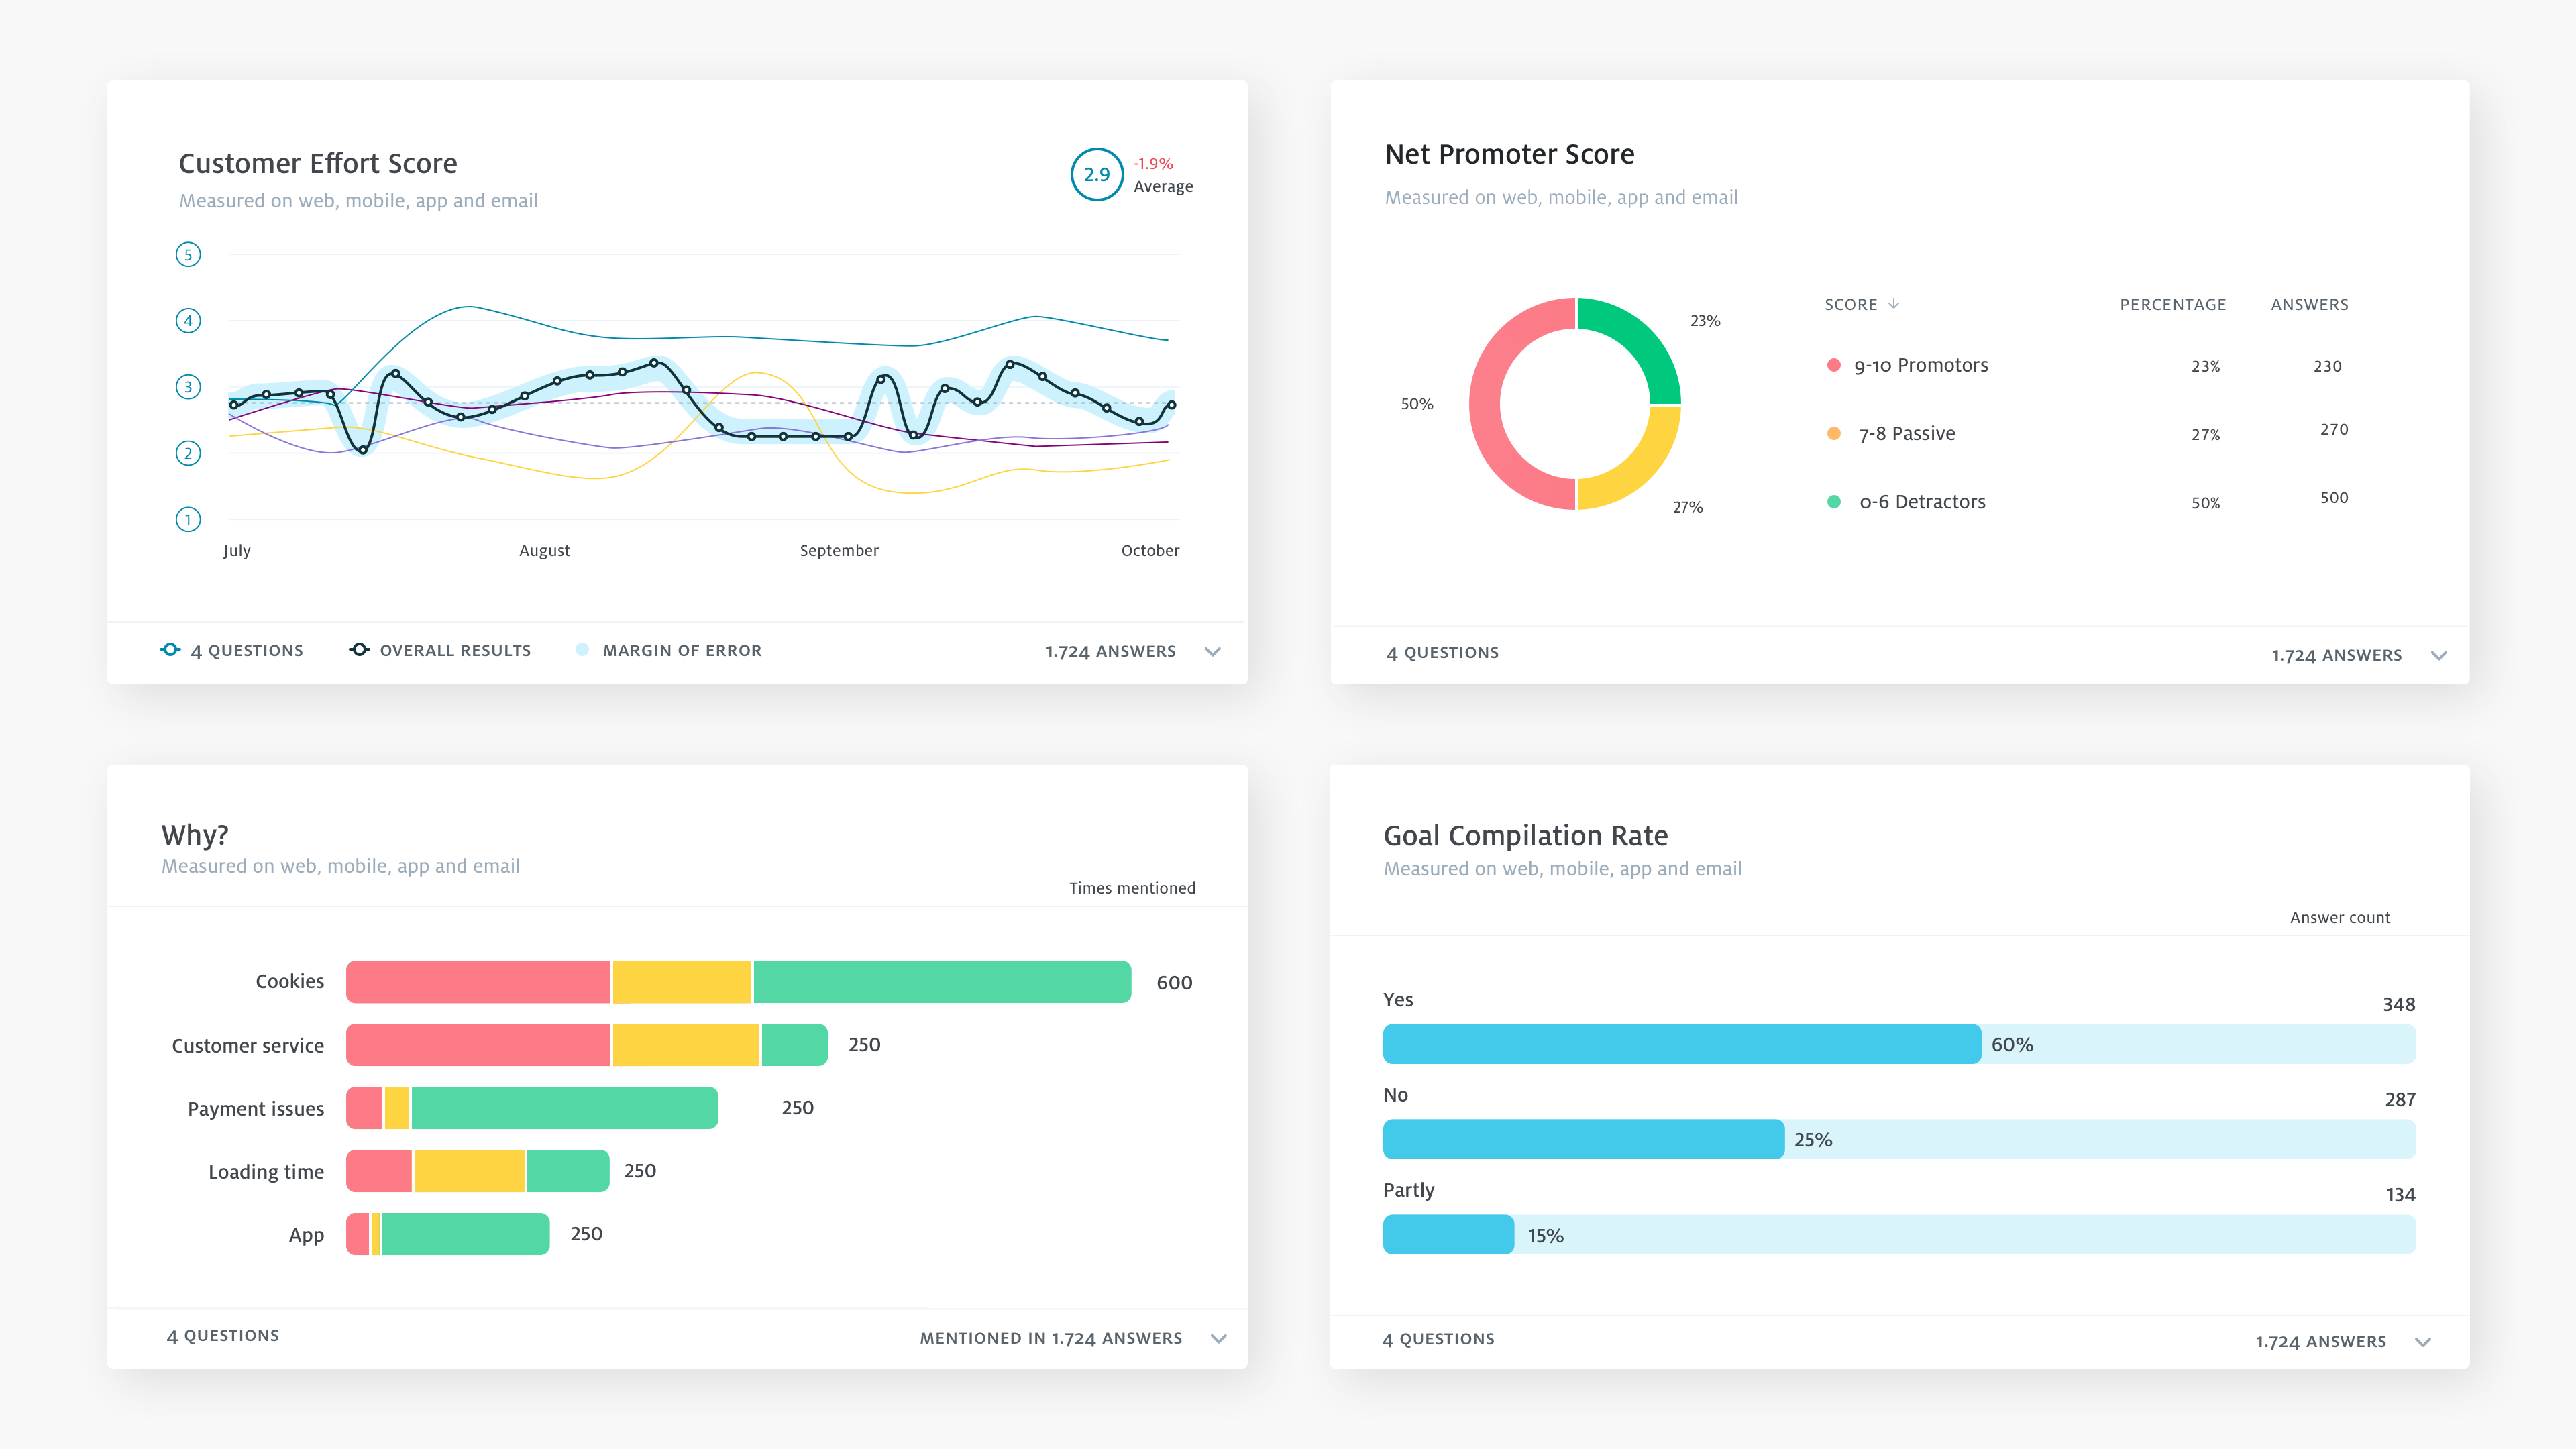
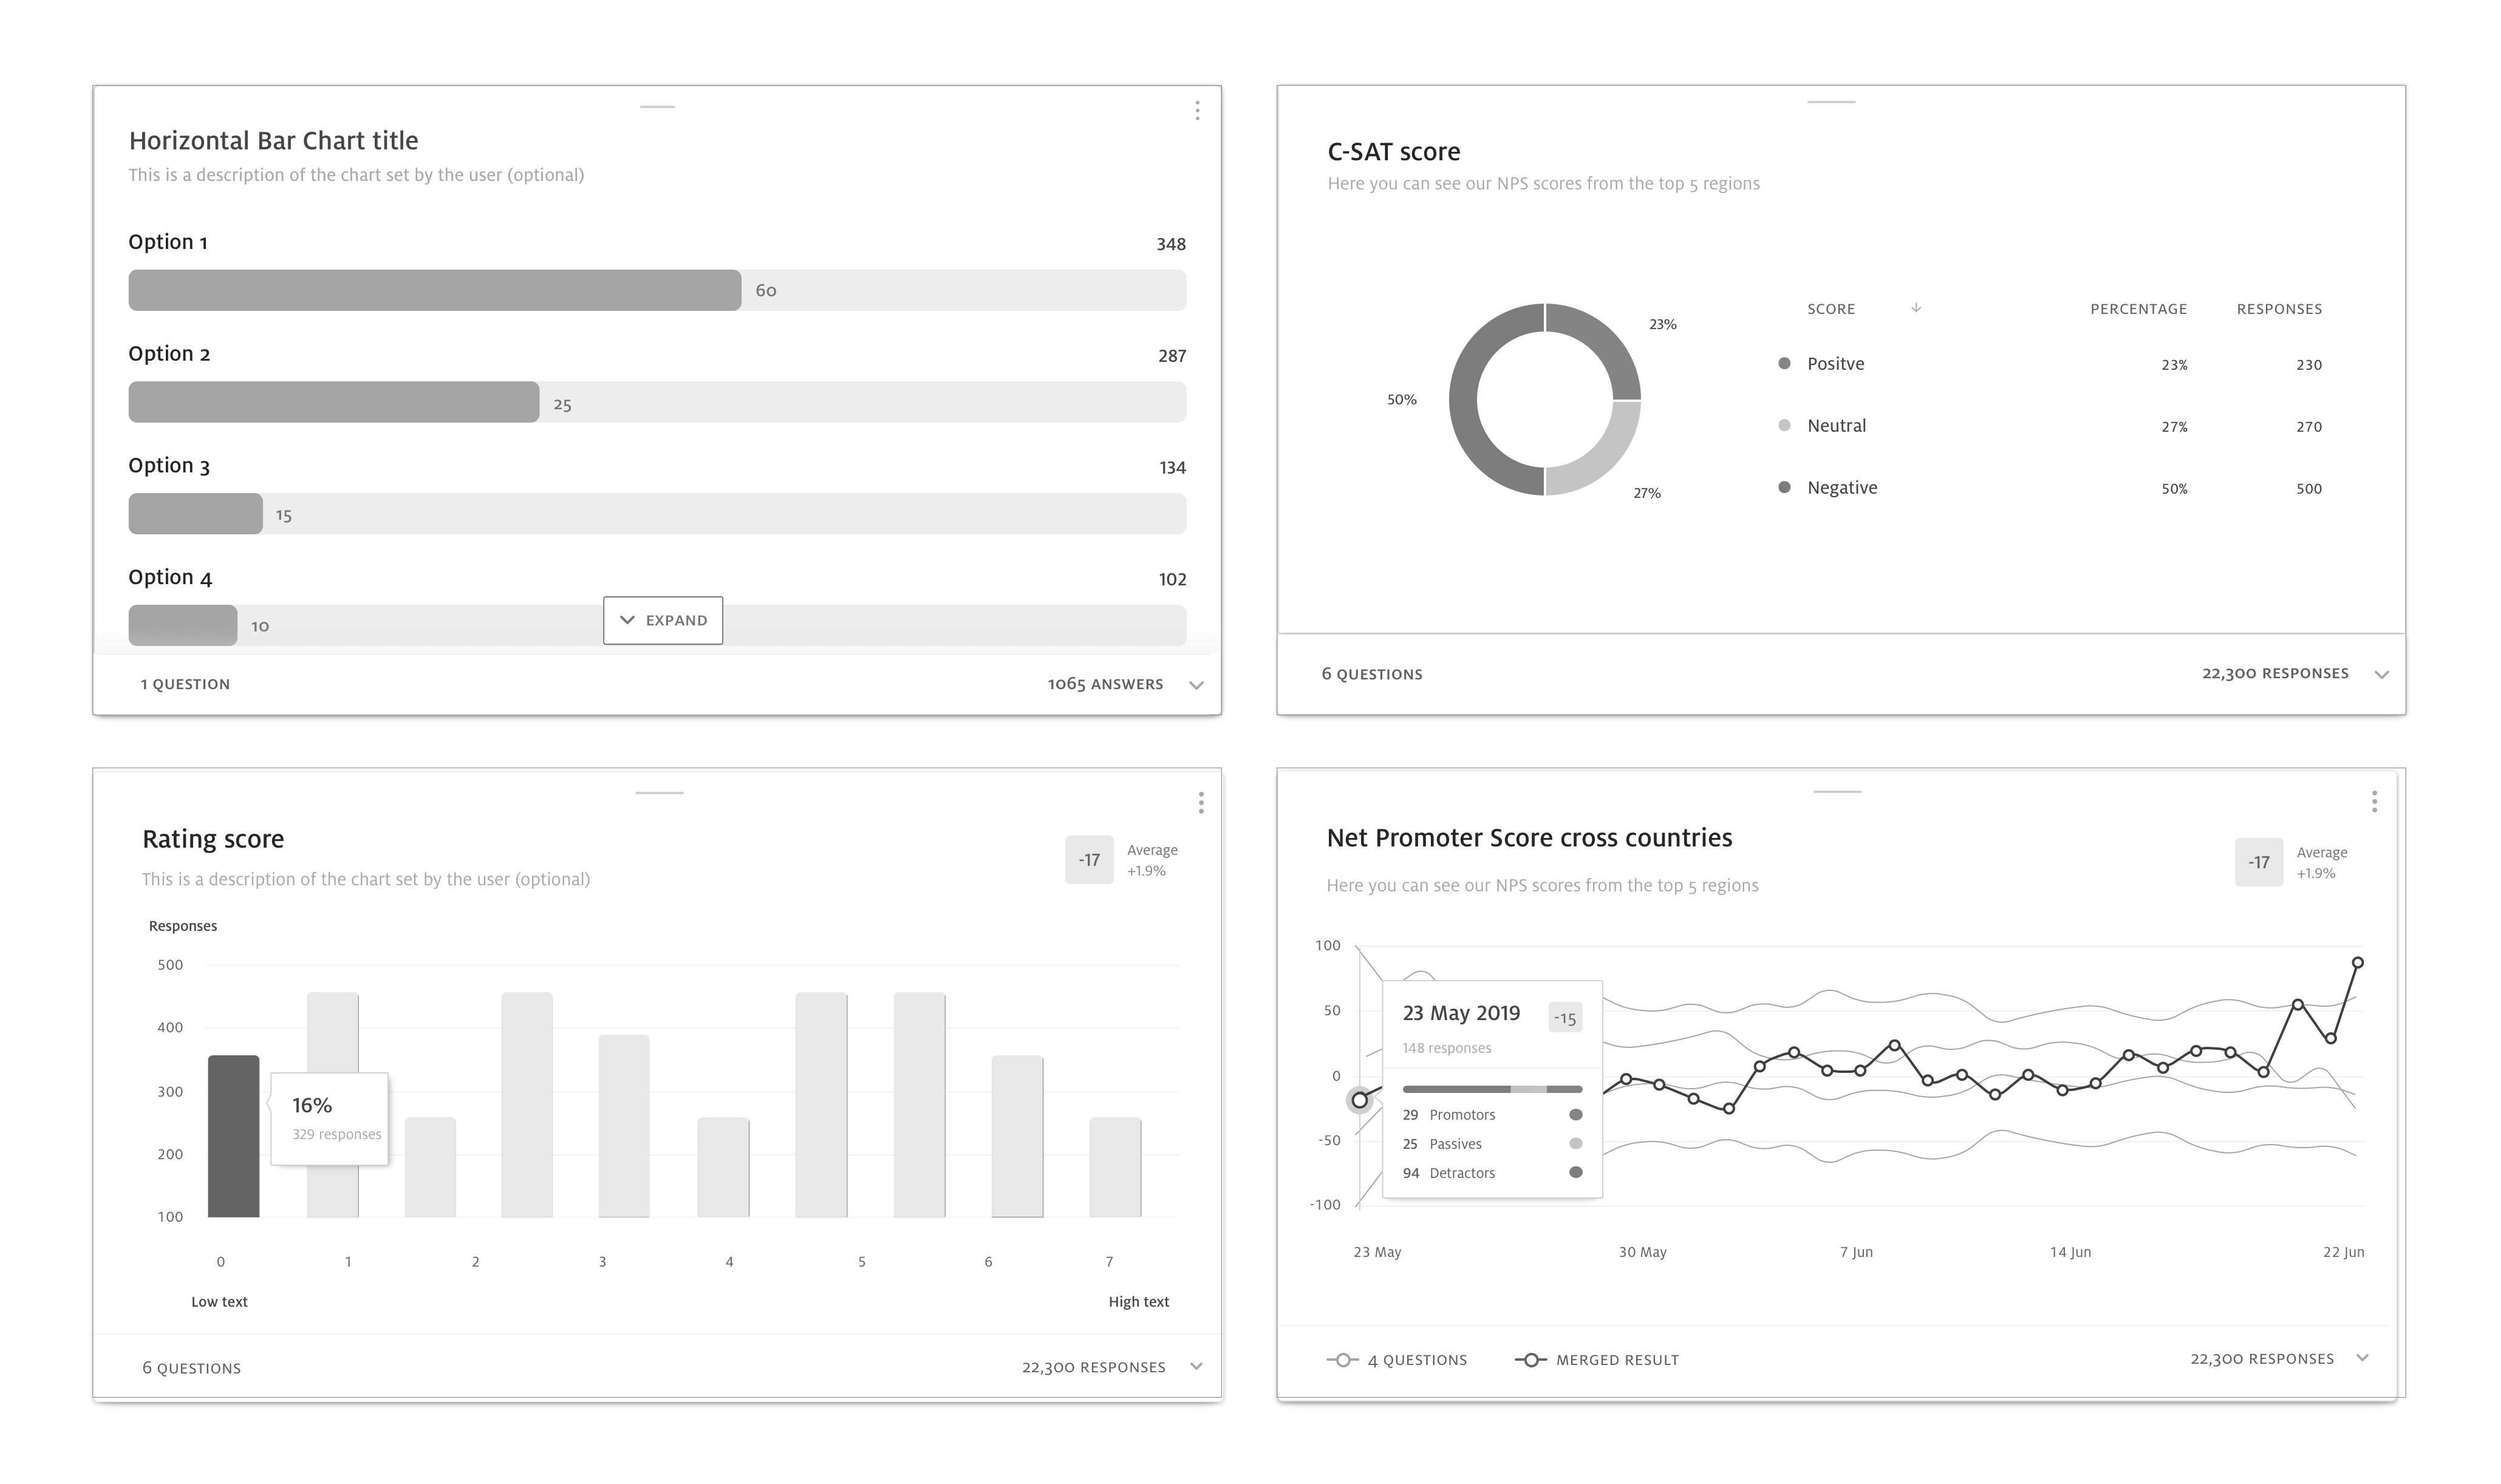
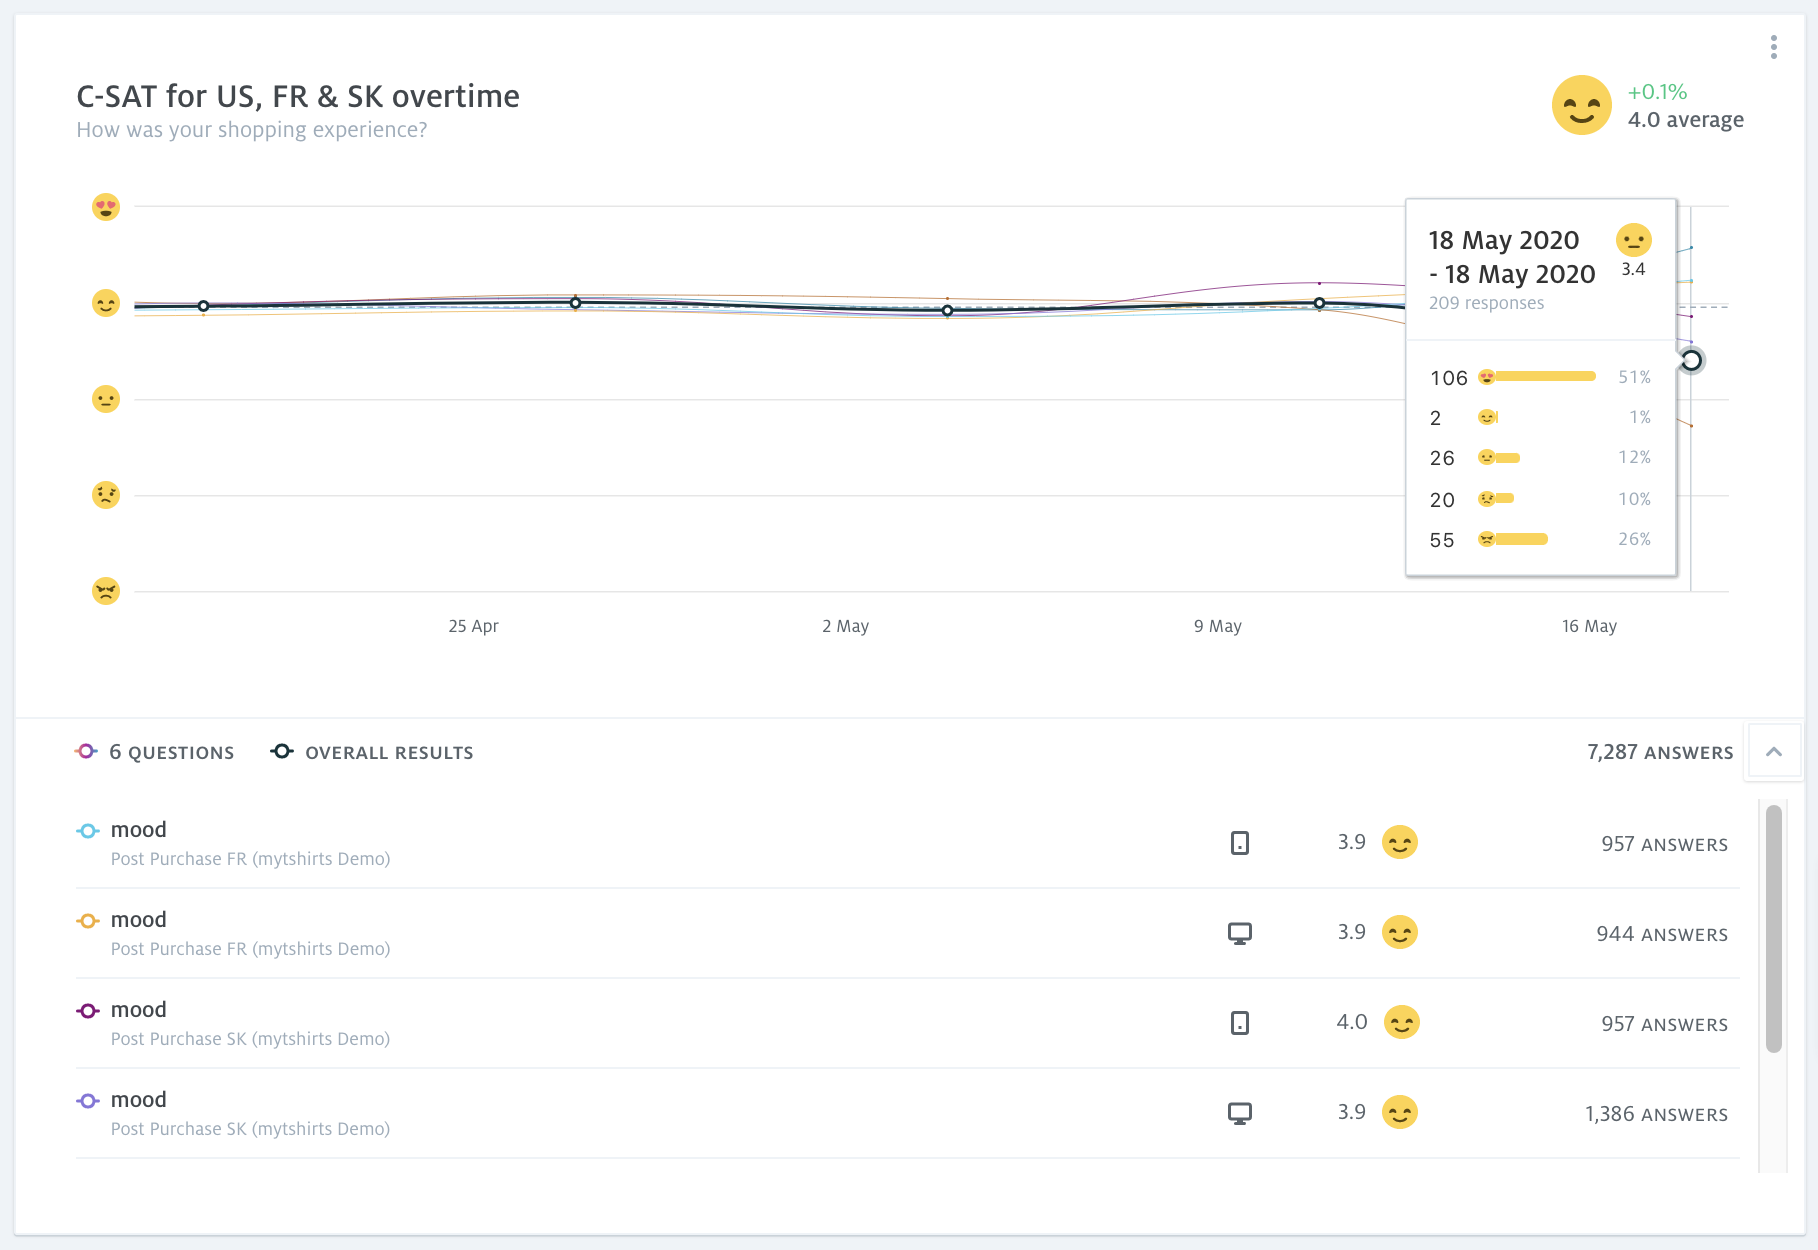
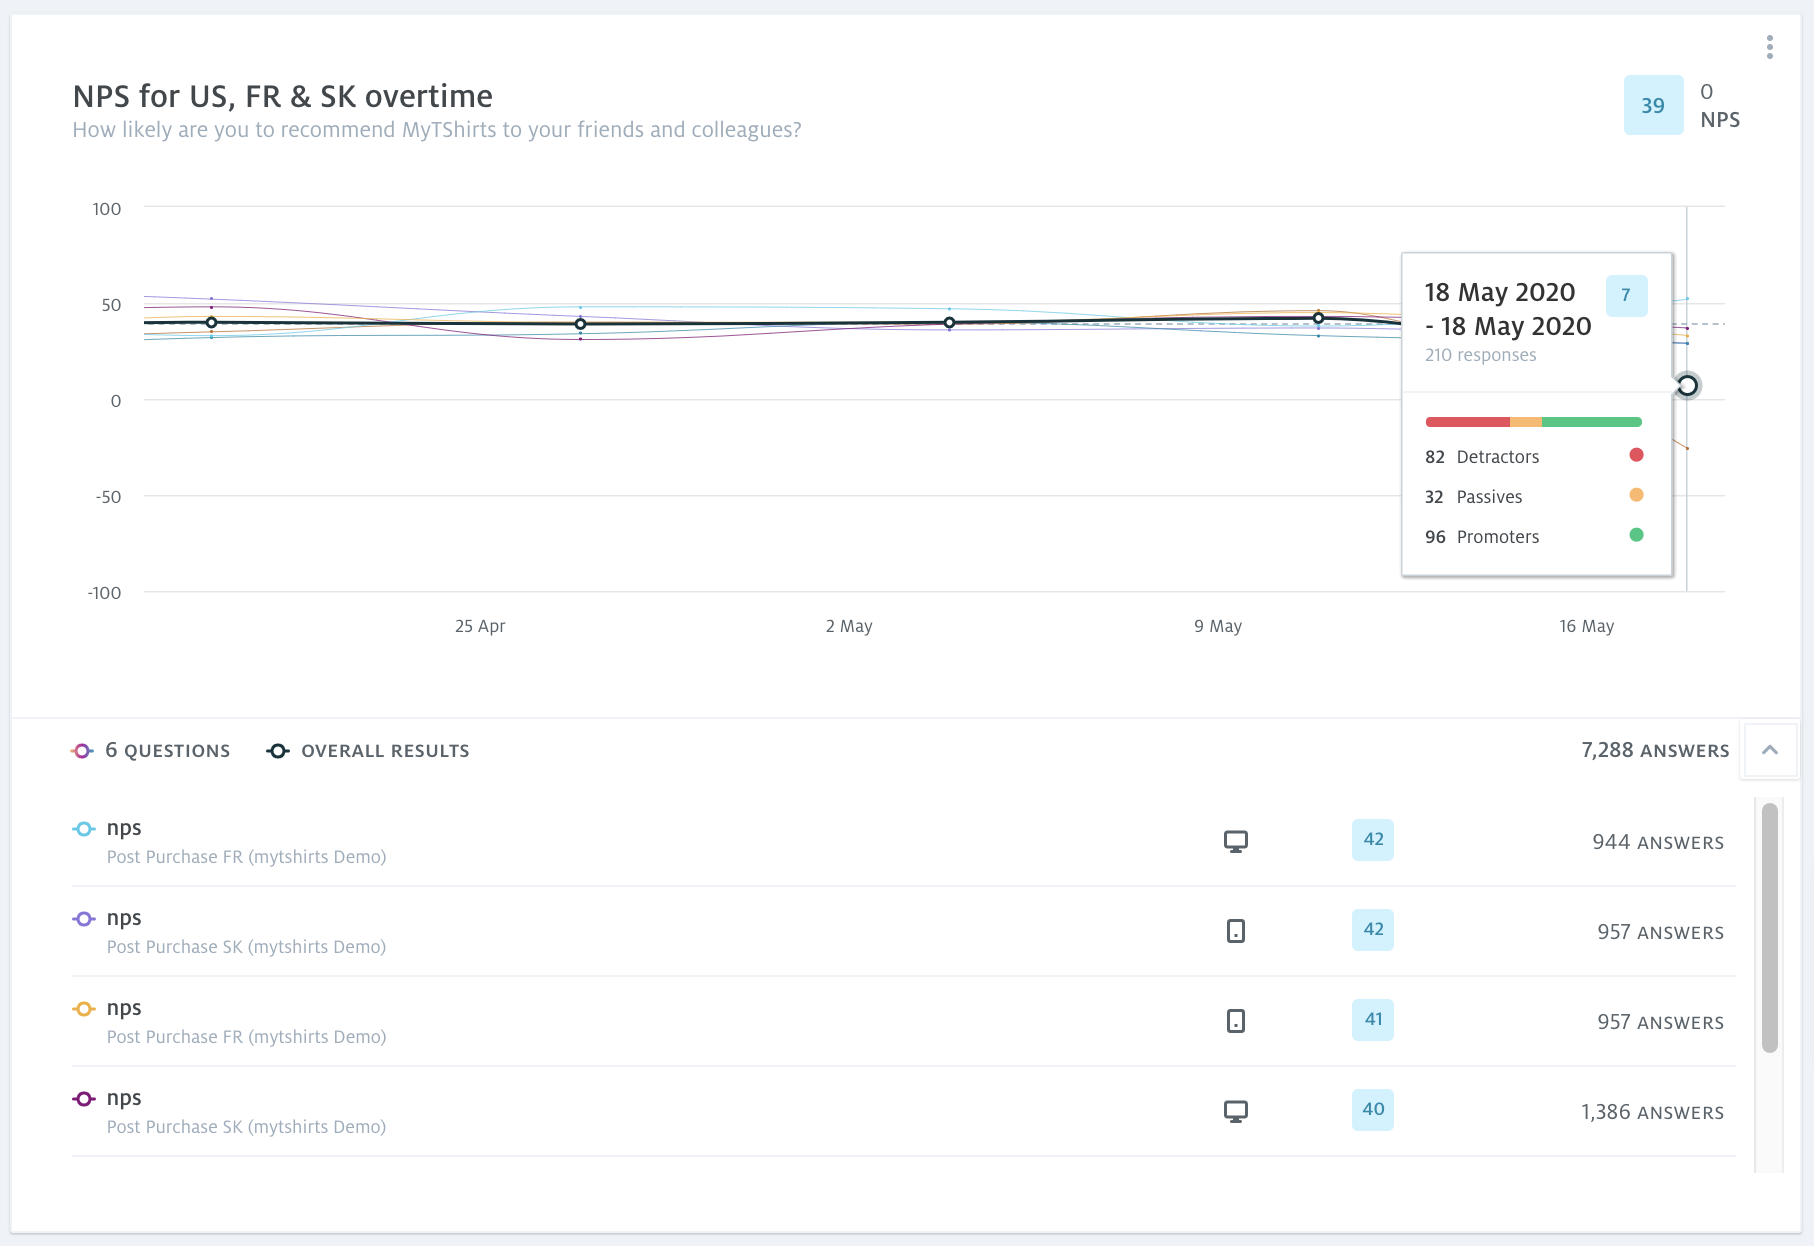
Data visualization
When customers are asking complex questions and tracking multiple KPIs, they want to manipulate the data so they can better understand the correlation between the scores and the answers.
General requirement:
- Name and description
- The data displays depend on the questions the users want to merge or compare
- The visualization options depend on the best practice per data type.
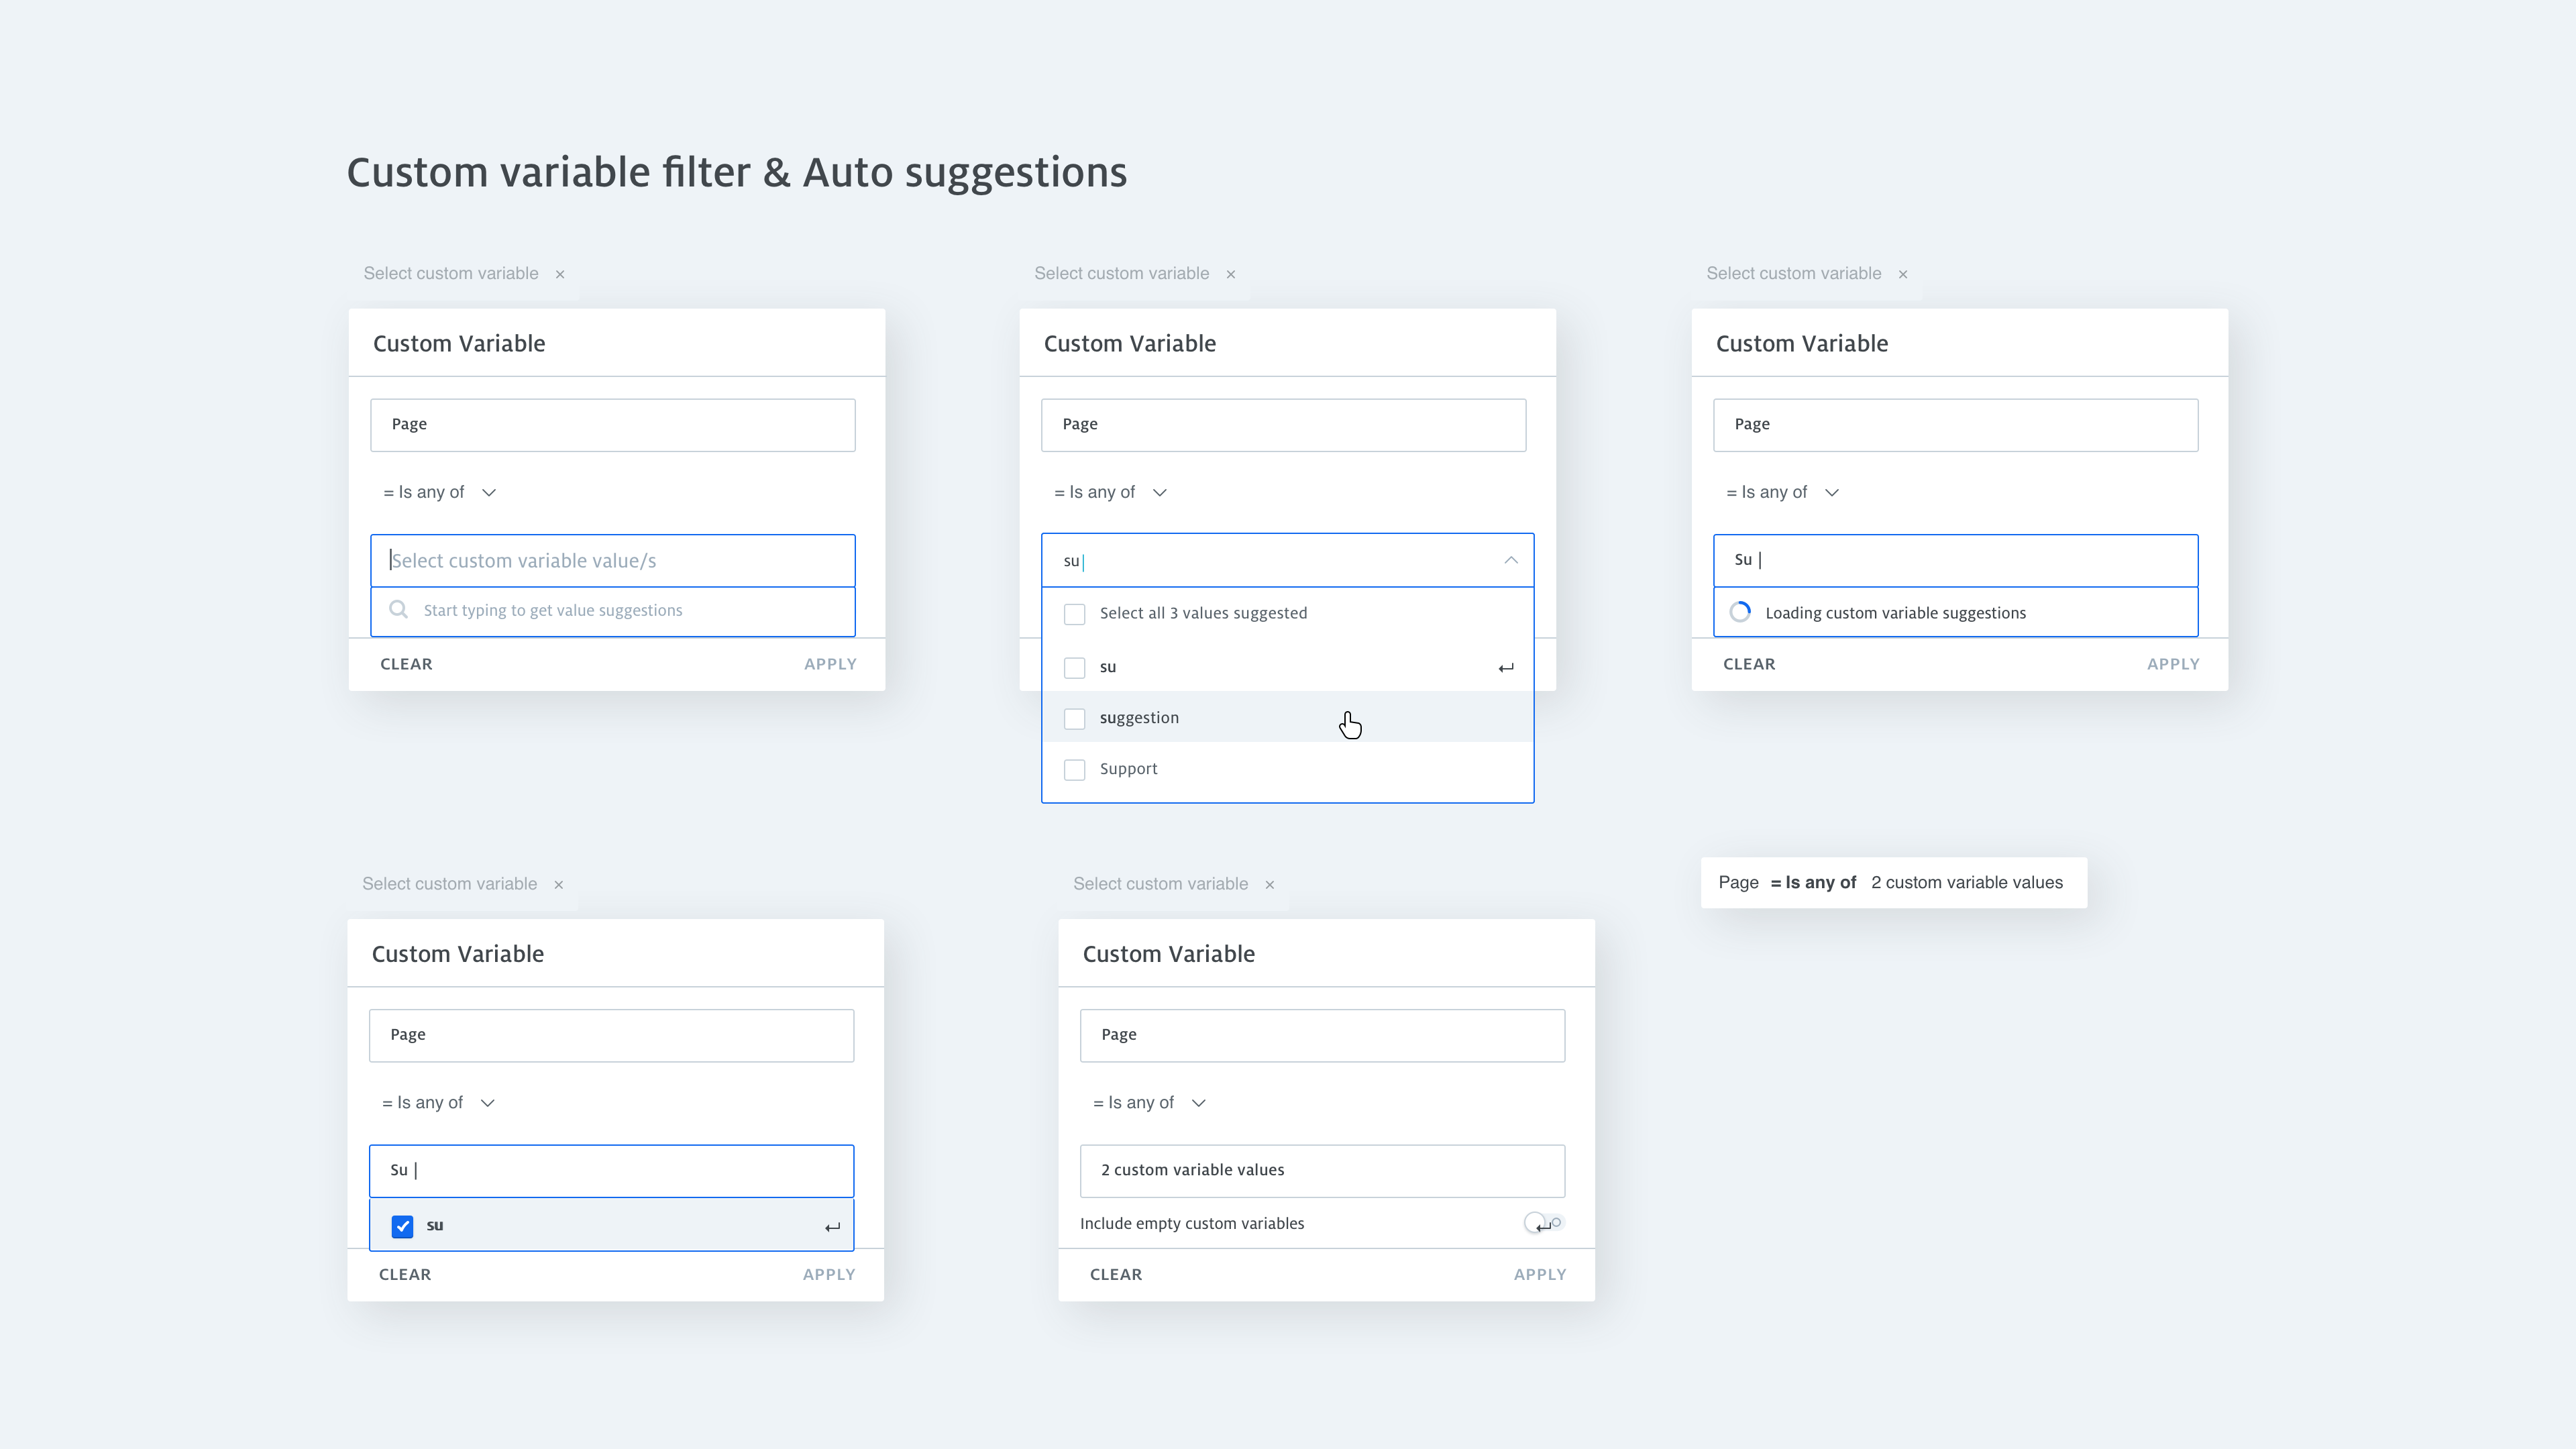
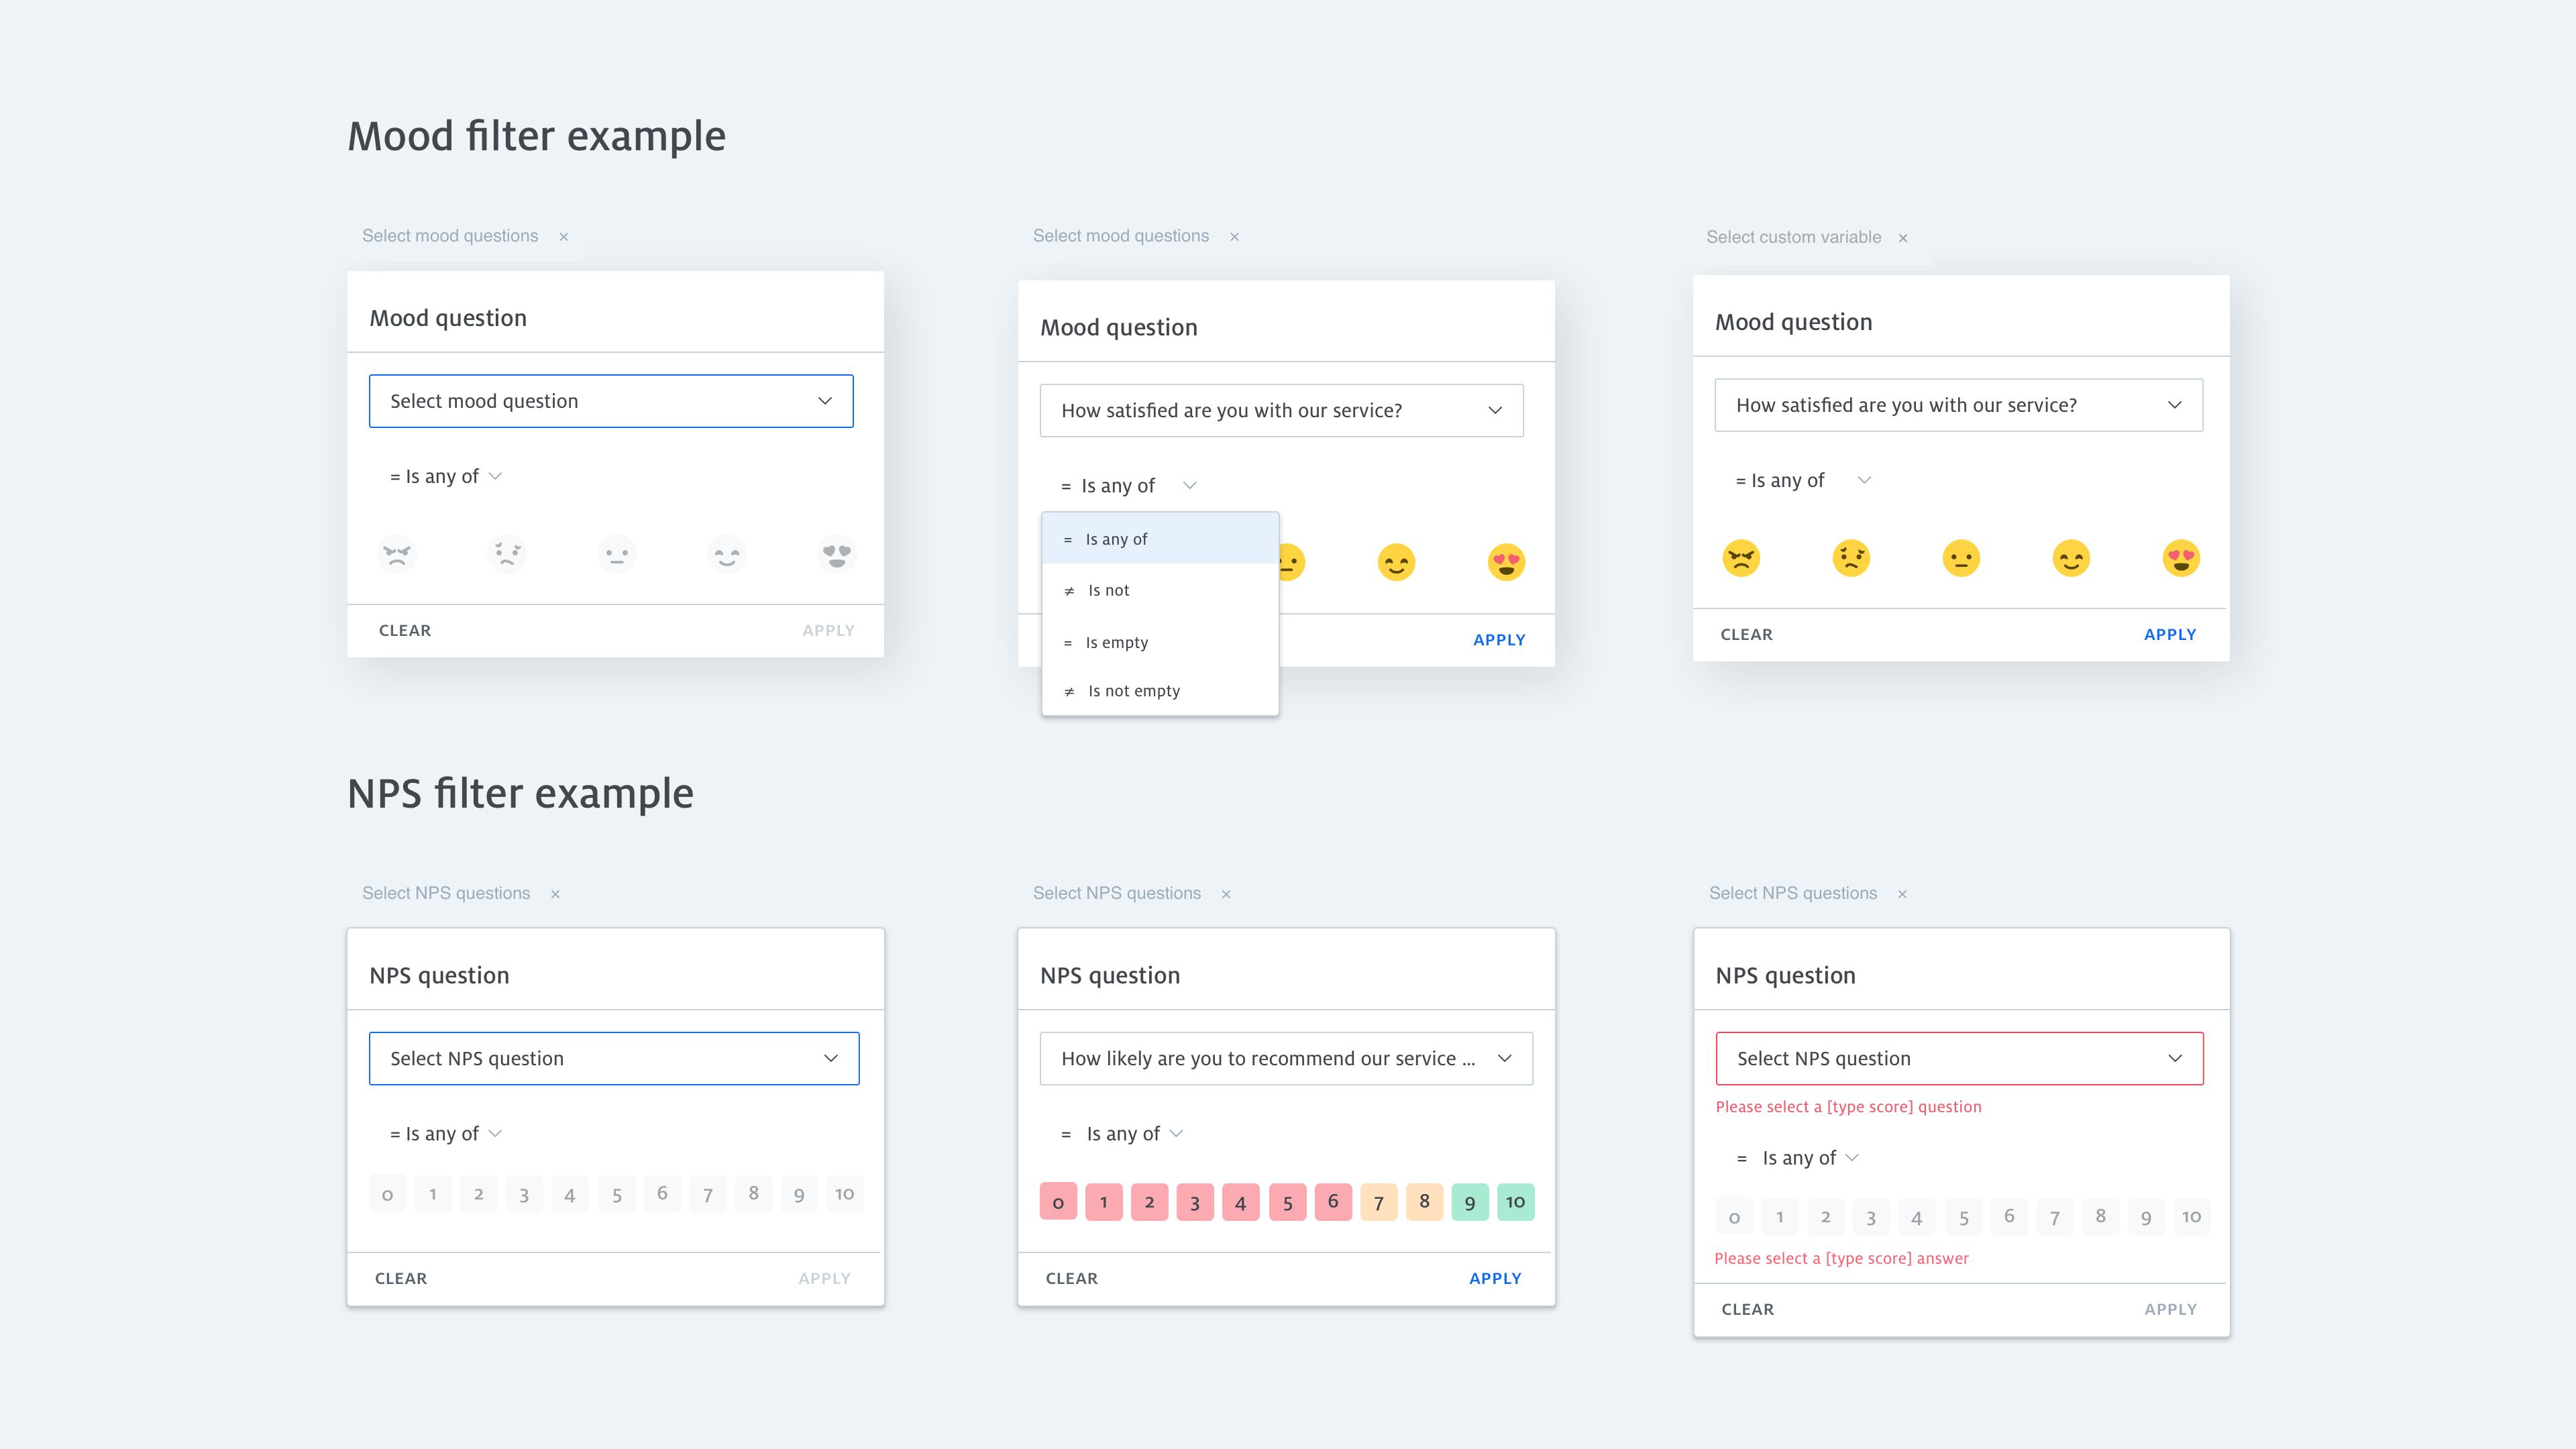
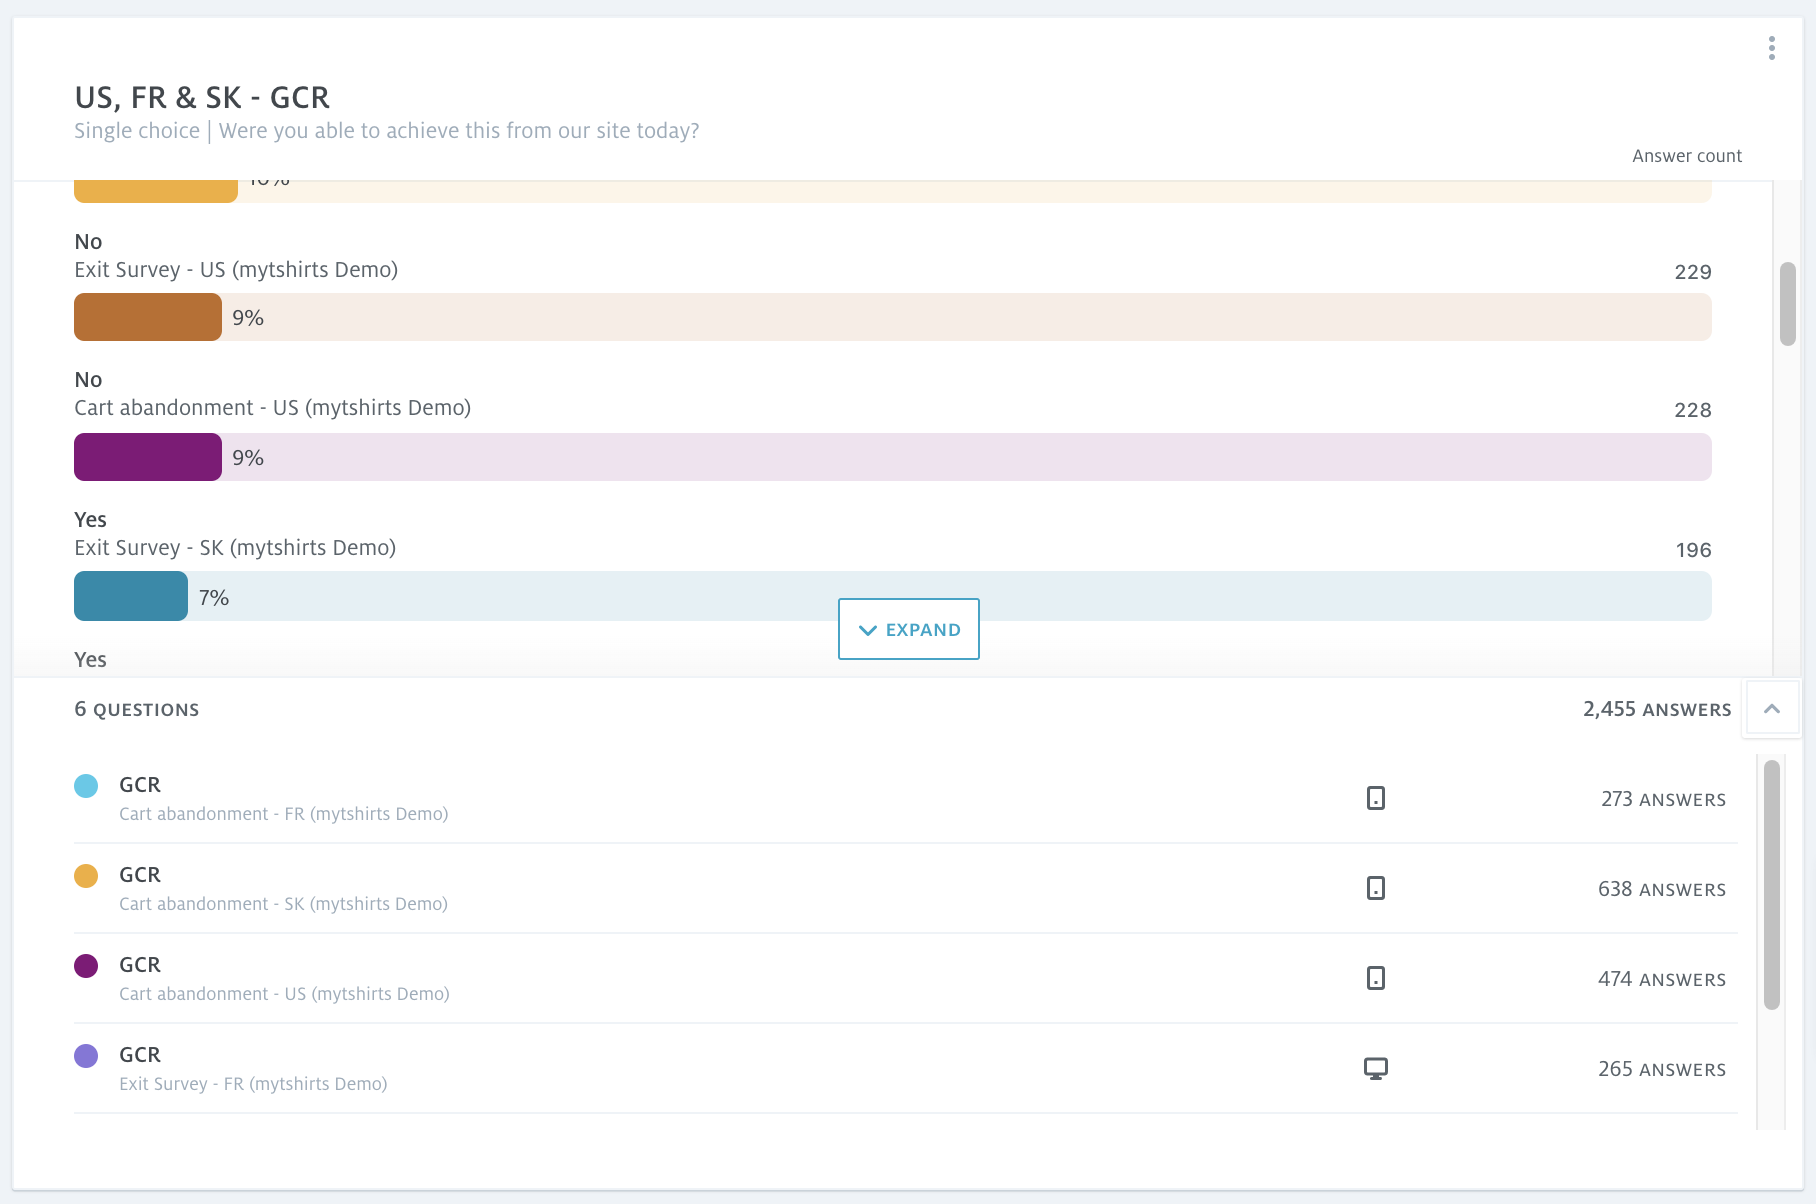
Filter and query
When customers are asking different questions and tracking multiple KPIs, they want to manipulate the data so they can better understand the correlation between the scores and the answers.
The users can add filters or drill-down to investigate the results and get a better understanding by reading the relevant user open text feedback. Users can filter by date, form, custom variable, URL, scores, answers, open text, metadata, and more. For every filter, I had to design the different steps with different conditions, keeping the interaction efficient, quick, and clear.
Success metrics
Aug 2019
12
Early access customersFeb 2020
100
Customers and releasing for general availabilityMay 2020
20%
GrowthWe have weekly active customers such as Crocs, Ticket Master, Videoland, Aegon, and many more. Using Workspaces as their primary CX analytics tool. We are working towards expanding functionalities and increasing usage of different departments within the organization.